
File:1975 – Price of solar panels as a function of cumulative installed capacity.svg

Size of this PNG preview of this SVG file: 800 × 600 pixels. Other resolutions: 320 × 240 pixels | 640 × 480 pixels | 1,024 × 768 pixels | 1,280 × 960 pixels | 2,560 × 1,920 pixels | 1,000 × 750 pixels.
Original file (SVG file, nominally 1,000 × 750 pixels, file size: 6 KB)
| This is a file from the Wikimedia Commons. Information from its description page there is shown below. Commons is a freely licensed media file repository. You can help. |
Summary
| Description |
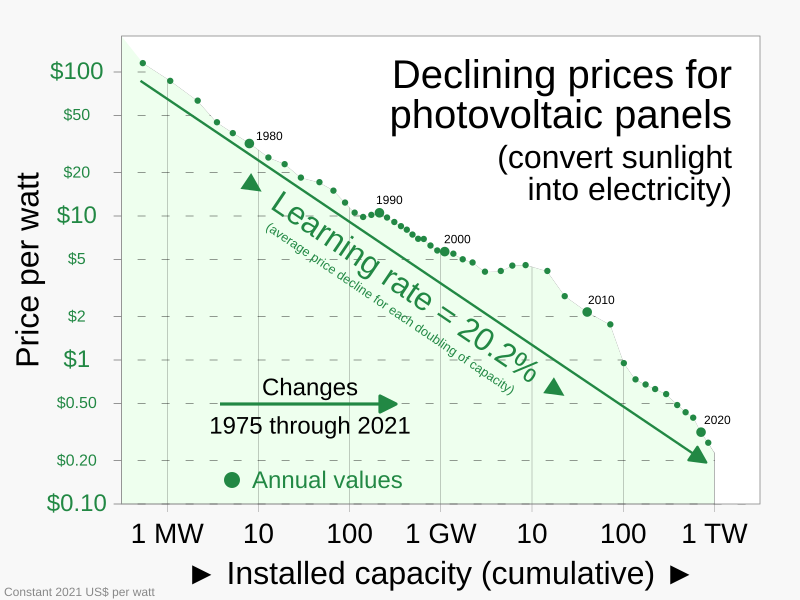
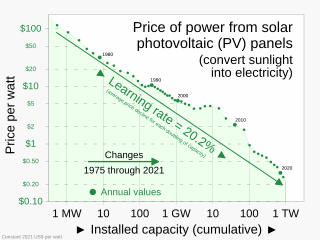
English: Chart showing the price of solar photovoltaic panels as a function of cumulative installed capacity, with annual values beginning in 1975
|
||
| Date | |||
| Source | Own work | ||
| Author | RCraig09 |

Related file
-
 Solar-pv-prices-vs-cumulative-capacity.png
PNG predecessor

Licensing
I, the copyright holder of this work, hereby publish it under the following license:
This file is licensed under the Creative Commons Attribution-Share Alike 4.0 International license.
- You are free:
- to share – to copy, distribute and transmit the work
- to remix – to adapt the work
- Under the following conditions:
- attribution – You must give appropriate credit, provide a link to the license, and indicate if changes were made. You may do so in any reasonable manner, but not in any way that suggests the licensor endorses you or your use.
- share alike – If you remix, transform, or build upon the material, you must distribute your contributions under the same or compatible license as the original.
File history
Click on a date/time to view the file as it appeared at that time.
| Date/Time | Thumbnail | Dimensions | User | Comment | |
|---|---|---|---|---|---|
| current | 14:52, 15 October 2023 | | 1,000 × 750 (6 KB) | RCraig09 | Version 9: add "(convert sunlight into electricity)" per Talk Page |
| 00:33, 9 October 2023 |  | 1,000 × 750 (6 KB) | RCraig09 | Version 8: remove "for for" in title . . . . add explanatory material to title | |
| 04:44, 8 October 2023 |  | 1,000 × 750 (5 KB) | RCraig09 | Version 7: white out gridlines over trace | |
| 20:44, 6 October 2023 |  | 1,000 × 750 (5 KB) | RCraig09 | Version 6: revise title per Talk Page . . . . add subtext re Learning Rate | |
| 04:00, 4 October 2023 |  | 1,000 × 750 (5 KB) | RCraig09 | Version 5: Vertical axis label changed from "Cost" to "Price" . . . Title changed to simply, "Solar power" | |
| 21:03, 3 October 2023 |  | 1,000 × 750 (5 KB) | RCraig09 | Version 4: miscellaneous changes discussed on Talk Page | |
| 16:50, 3 October 2023 |  | 1,000 × 750 (5 KB) | RCraig09 | Version 3: Add labels for decades . . . . add "► Learning curve ►" label . . . per Talk Page 3 October 2023 | |
| 02:36, 30 September 2023 |  | 1,000 × 750 (5 KB) | RCraig09 | Version 2: change "to" ----> "through" | |
| 01:48, 30 September 2023 |  | 1,000 × 750 (5 KB) | RCraig09 | Uploaded own work with UploadWizard |
File usage
The following pages on the English Wikipedia use this file (pages on other projects are not listed):
Global file usage
The following other wikis use this file:
- Usage on es.wikipedia.org
- Usage on fr.wikipedia.org