
File:Pop continents 2000 2050.png
Original file (825 × 443 pixels, file size: 27 KB, MIME type: image/png)
| This is a file from the Wikimedia Commons. Information from its description page there is shown below. Commons is a freely licensed media file repository. You can help. |
Summary
| Description |
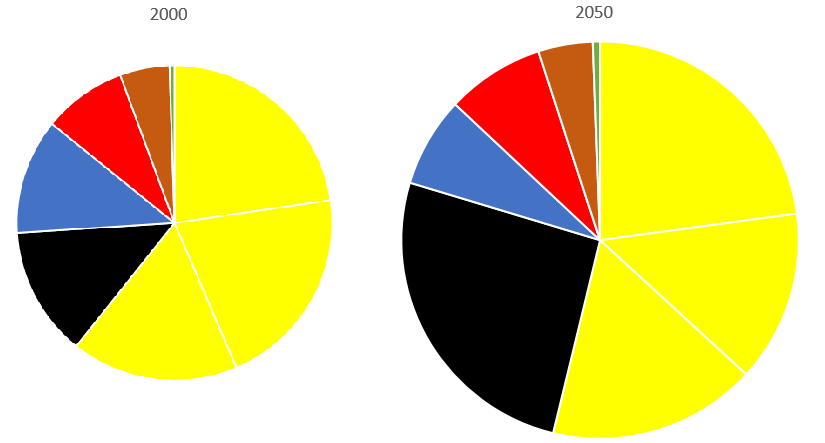
English: UN population estimates by continent for 2000 and 2050.
Data from UN World Population Prospects 2017. Projections for 2050 are the "median" estimates of the 2017 edition of UN World Population Prospects. color code selected for consistency with File:World population (UN).svg: yellow: Asia, black: Africa, blue: Europe, red: South+Central America + Caribbean, brown: North America, green: Oceania. The two pie chart sizes are to scale (area ratio 1.60, diameter ratio 1.26) Data for Asia is shown divided into three sections, Asia (other), China, India, to represent China and India separately as the two most populous countries.
Average population growth is projected as +60%, or 0.94% p.a. on average. Growth is driven by the disproportionate growth of African population (+209%, 2.3% p.a.), offset by the near-stagnation in China (+6%, 0.1% p.a.) and in Europe (-1.7%, -0.03% p.a.). |
| Date | |
| Source | self made (source of data: see description) |
| Author | Own work |
.svg)
Licensing

|
Permission is granted to copy, distribute and/or modify this document under the terms of the GNU Free Documentation License, Version 1.2 or any later version published by the Free Software Foundation; with no Invariant Sections, no Front-Cover Texts, and no Back-Cover Texts. A copy of the license is included in the section entitled GNU Free Documentation License. |
- You are free:
- to share – to copy, distribute and transmit the work
- to remix – to adapt the work
- Under the following conditions:
- attribution – You must give appropriate credit, provide a link to the license, and indicate if changes were made. You may do so in any reasonable manner, but not in any way that suggests the licensor endorses you or your use.
- share alike – If you remix, transform, or build upon the material, you must distribute your contributions under the same or compatible license as the original.
File history
Click on a date/time to view the file as it appeared at that time.
| Date/Time | Thumbnail | Dimensions | User | Comment | |
|---|---|---|---|---|---|
| current | 10:25, 3 April 2018 | | 825 × 443 (27 KB) | Dbachmann | {{Information |description ={{en|1=population estimates by continent for 2000 and 2050 (details tba)}} |source =self made (source of data: see description) |author ={{own}} |date =2018-04-03 }} Category:Population growth Category:World population statistics Category:Demography |
File usage
Global file usage
The following other wikis use this file:
- Usage on ar.wikipedia.org