
File:Visual Smith Chart.png

Size of this preview: 513 × 600 pixels. Other resolutions: 205 × 240 pixels | 410 × 480 pixels | 657 × 768 pixels | 1,146 × 1,340 pixels.
Original file (1,146 × 1,340 pixels, file size: 356 KB, MIME type: image/png)
| This is a file from the Wikimedia Commons. Information from its description page there is shown below. Commons is a freely licensed media file repository. You can help. |
Transferred from en.wikipedia to Commons by Maksim.
The original description page was here. All following user names refer to en.wikipedia.
Summary
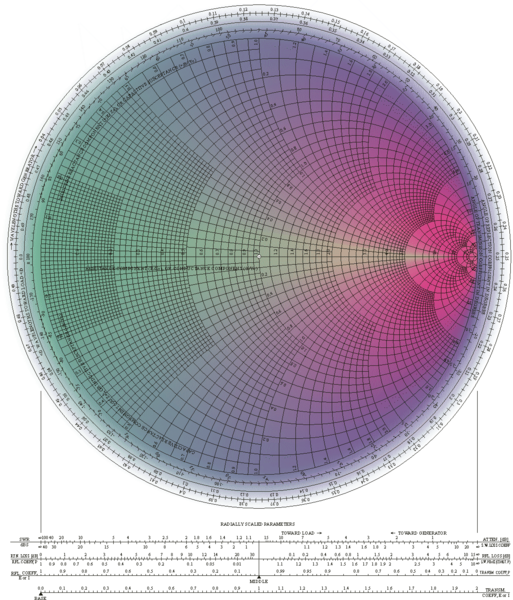
PNG image of SVG Visual Magic vector Smith Chart referencing 22m relative coefficient points plotted as a dual spectrum JPG background
Smith Chart visual representation of interaction between resistive and reactive components

|
This diagram image could be re-created using vector graphics as an SVG file. This has several advantages; see Commons:Media for cleanup for more information. If an SVG form of this image is available, please upload it and afterwards replace this template with
{{vector version available|new image name}}.
It is recommended to name the SVG file “Visual Smith Chart.svg”—then the template Vector version available (or Vva) does not need the new image name parameter. |
Licensing
I, the copyright holder of this work, hereby publish it under the following licenses:

|
Permission is granted to copy, distribute and/or modify this document under the terms of the GNU Free Documentation License, Version 1.2 or any later version published by the Free Software Foundation; with no Invariant Sections, no Front-Cover Texts, and no Back-Cover Texts. A copy of the license is included in the section entitled GNU Free Documentation License. |
| This file is licensed under the Creative Commons Attribution-Share Alike 3.0 Unported license. | ||
| ||
| This licensing tag was added to this file as part of the GFDL licensing update. |
You may select the license of your choice.
| date/time | username | edit summary |
|---|---|---|
| 15:47, 4 January 2006 | en:User:Jamal al din | (PNG image of SVG Visual Magic vector Smith Chart referencing 22m relative coefficient points plotted as a dual spectrum JPG background Smith Chart visual representation of interaction between resistive and reactive compnents) |
Original upload log
Legend: (cur) = this is the current file, (del) = delete this old version, (rev) = revert to this old version.
Click on date to download the file or see the image uploaded on that date.
- (del) (cur) 15:47, 4 January 2006 . . en:User:Jamal_al_din Jamal al din ( en:User_talk:Jamal_al_din Talk) . . 1146x1340 (364497 bytes) (PNG image of SVG Visual Magic vector Smith Chart referencing 22m relative coefficient points plotted as a dual spectrum JPG background Smith Chart visual representation of interaction between resistive and reactive compnents)
File history
Click on a date/time to view the file as it appeared at that time.
| Date/Time | Thumbnail | Dimensions | User | Comment | |
|---|---|---|---|---|---|
| current | 20:05, 19 March 2006 | | 1,146 × 1,340 (356 KB) | Maksim | La bildo estas kopiita de wikipedia:en. La originala priskribo estas: == Summary == PNG image of SVG Visual Magic vector Smith Chart referencing 22m relative coefficient points plotted as a dual spectrum JPG background Smith Chart visual representati |
File usage
The following pages on the English Wikipedia use this file (pages on other projects are not listed):
Global file usage
The following other wikis use this file:
- Usage on ar.wikipedia.org
- Usage on az.wikipedia.org
- Usage on be.wikipedia.org
- Usage on ca.wikipedia.org
- Usage on da.wikipedia.org
- Usage on de.wikipedia.org
- Usage on eo.wikipedia.org
- Usage on es.wikipedia.org
- Usage on gl.wiktionary.org
- Usage on hi.wikipedia.org
- Usage on it.wikipedia.org
- Usage on nl.wikipedia.org
- Usage on nl.wikibooks.org
- Usage on pt.wikipedia.org
- Usage on ro.wikipedia.org
- Usage on ru.wikipedia.org
- Usage on sv.wikipedia.org
- Usage on vi.wikipedia.org
- Usage on zh.wikipedia.org