
1982 London local elections
| |||||||||||||||||||||||||||||||||||||||||||||
All 1,914 on all 32 London boroughs | |||||||||||||||||||||||||||||||||||||||||||||
|---|---|---|---|---|---|---|---|---|---|---|---|---|---|---|---|---|---|---|---|---|---|---|---|---|---|---|---|---|---|---|---|---|---|---|---|---|---|---|---|---|---|---|---|---|---|
| |||||||||||||||||||||||||||||||||||||||||||||
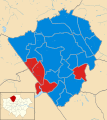
 Results by Borough in 1982. | |||||||||||||||||||||||||||||||||||||||||||||
.jpg)
.jpg)
Local government elections took place in London, and some other parts of the United Kingdom on Thursday 6 May 1982. Ward changes took place in Enfield which increased the total number of councillors by 6 from 1,908 to 1,914.
All London borough council seats were up for election. Both major parties lost votes to the SDP-Liberal Alliance, but whilst the Conservatives gained 20 council seats, Labour lost 101.
The party's result of 30.4%, 12 councils and 781 councillors was the worst Labour result since 1968.
The previous Borough elections in London were in 1978.[1]
To date, this remains the last London local election in which the Conservatives won a majority of council seats or councils, as well as the last time the party won over 40% of the vote. The Conservatives would not win the popular vote in a London local election for another two decades, and would not win a plurality of seats in London again until the election of 2006, 24 years later.
Results summary[edit]
| Party[2] | Votes won | % votes | Change | Seats | % seats | Change | Councils | Change | |
|---|---|---|---|---|---|---|---|---|---|
| Conservative | 912,005 | 42.2 | -6.5 | 984 | 51.4 | +24 | 17 | ±0 | |
| Labour | 652,430 | 30.2 | -8.9 | 781 | 40.8 | -101 | 12 | -2 | |
| Alliance | 530,340 | 24.6 | +17.5 | 124 | 6.5 | +94 | 0 | ±0 | |
| Others | 64,387 | 3.0 | -2.1 | 25 | 1.3 | -11 | 0 | ±0 | |
| No overall control | n/a | n/a | n/a | n/a | n/a | n/a | 3 | +2 | |
- Turnout: 2,233,386 voters cast ballots.[3]
Council results[edit]
Borough result maps[edit]
-
 Barnet 1982 results map
 -
 Camden 1982 results map
 -
 Hammersmith and Fulham 1982 results map


References[edit]
- ^ Minors, Michael; Grenham, Dennis. "London Borough Council Elections 7 May 1998 including the Greater London Authority Referendum results" (PDF). Demographic and Statistical Studies. London Research Centre. Retrieved 29 May 2014.
- ^ "Year Tables". electionscentre.co.uk. 19 December 2015. Archived from the original on 18 June 2016.
- ^ "London Borough Council Elections 6 May 1982" (PDF). londondatastore-upload.s3.amazonaws.com. 1982. Archived (PDF) from the original on 2 April 2015.