Crystal Palace and Upper Norwood (ward)
(Redirected from Crystal Palace & Upper Norwood (ward))
| Crystal Palace & Upper Norwood | |
|---|---|
| ward for Croydon Council | |
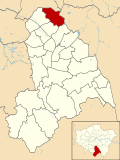
 Boundary of Crystal Palace & Upper Norwood in Croydon from 2018. | |
| County | Greater London |
| Current ward | |
| Created | 2018 |
| Councillor | Patsy Cummings (Labour) |
| Councillor | Nina Degrads (Labour) |
| Councillor | Claire Bonham (Liberal Democrats) |
| Number of councillors | Three |
| Created from | Upper Norwood and South Norwood |
| UK Parliament constituency | Croydon North |
Crystal Palace & Upper Norwood is a ward electing 3 councillors in the London Borough of Croydon.[1][2] The ward came into existence on 3 May 2018.[citation needed]
List of Councillors[edit]
| Election | Councillor | Party | Councillor | Party | Councillor | Party | ||||||
|---|---|---|---|---|---|---|---|---|---|---|---|---|
| 2018 | Ward created | |||||||||||
| Pat Ryan | Labour | Nina Degrads | Labour | Stephen Mann | Labour | |||||||
| 2022 | Patsy Cummings | Labour | Claire Bonham | Liberal Democrats | ||||||||
Mayoral election results[edit]
Below are the results for the candidate which received the highest share of the popular vote in the ward at each mayoral election.
| Year | Mayoral candidate | Party | Winner? | |
|---|---|---|---|---|
| 2022 | Val Shawcross | Labour | ||
Ward results[edit]
| Party | Candidate | Votes | % | ±% | |
|---|---|---|---|---|---|
| Labour | Patsy Cummings† | 1,753 | |||
| Labour | Nina de Grads | 1,671 | |||
| Liberal Democrats | Claire Bonham | 1,641 | |||
| Labour | Christine Spooner | 1,531 | |||
| Liberal Democrats | Steven Penketh | 1,259 | |||
| Liberal Democrats | Costel Petre | 1,115 | |||
| Green | Rachel Chance | 946 | |||
| Green | Tom Chance | 698 | |||
| Green | Marcus Boyle | 660 | |||
| Conservative | Don Charles-Lambert | 633 | |||
| Conservative | Janet Wilkinson | 616 | |||
| Conservative | Gemma Patient | 605 | |||
| Turnout | 4,665 | 37.92 | |||
| Labour hold | Swing | ||||
| Labour hold | Swing | ||||
| Liberal Democrats gain from Labour | Swing | ||||
| Party | Candidate | Votes | % | ±% | |
|---|---|---|---|---|---|
| Labour | Pat Ryan | 2,399 | 17.75 | ||
| Labour | Nina Violet Degrads | 2,380 | 17.61 | ||
| Labour | Stephen James Mann | 2,215 | 16.39 | ||
| Liberal Democrats | Claire Bonham | 927 | 6.86 | ||
| Conservative | Gemma Marie Patient | 827 | 6.12 | ||
| Conservative | Andy Phillips | 819 | 6.06 | ||
| Conservative | Dan Edwardson | 813 | 6.02 | ||
| Liberal Democrats | Guy Burchett | 754 | 5.58 | ||
| Green | Rachel Mary Chance | 706 | 5.22 | ||
| Liberal Democrats | Chris Jordan | 614 | 4.54 | ||
| Green | Tom Chance | 499 | 3.69 | ||
| Green | Michael O'Sullivan | 456 | 3.37 | ||
| Independent | Andrew Rothschild | 107 | 0.79 | ||
| Majority | 1,288 | 9.53 | |||
| Turnout | |||||
| Labour hold | Swing | ||||
| Labour hold | Swing | ||||
| Labour hold | Swing | ||||
References[edit]
- ^ "Final recommendations on the new electoral arrangements for Croydon Borough of Croydon" (PDF). Retrieved 10 April 2018.
- ^ legislation.gov.uk -The London Borough of Croydon (Electoral Changes) Order 2017. Retrieved on 10 April 2018.
