
Electoral wards of Belfast
The electoral wards of Belfast are subdivisions of the city, used primarily for statistics and elections. Belfast had 51 wards from May 1973, which were revised in May 1985 and again in May 1993. The number of wards was increased to 60 with the 2014 changes in local government. Wards are the smallest administrative unit in Northern Ireland and are set by the Local Government Boundaries Commissioner and reviewed every 8–12 years.[1]
Wards are used to create constituencies for local government authorities, the Northern Ireland Assembly and the House of Commons of the United Kingdom. In elections to Belfast City Council, the 60 wards are split into ten District Electoral Areas, each of which contains between five and seven wards, with the number of councillors it elects equal to the number of wards it contains. The constituencies for elections to the House of Commons and the Assembly are coterminous and are created by amalgamating wards into larger areas, with the city's wards split between the four 'Belfast' constituencies, although these also contain wards from bordering local authorities.
The use of wards for statistical purposes by the Northern Ireland Statistics and Research Agency (NISRA) has changed since the creation of 'Census Output Areas' (5022 in total) and 'Super Output Areas' (890 in total), which were created to address the variance in size of the 582 wards across Northern Ireland.[2] Each ward contains several Super Output Area, which in turn are made up of a number of Census Output Areas.
Current wards[edit]
This section needs expansion. You can help by adding to it. (May 2023) |
The wards were redrawn for the 2014 elections.[3]
.png)
History[edit]
From 1928 until May 1973, Belfast was divided into 15 wards, each represented by a total of four aldermen or councillors. The 15 wards were Duncairn, Dock, Clifton, Shankill, Court, Woodvale, Smithfield, Falls, Saint Anne's, Saint George's, Windsor, Cromac, Ormeau, Pottinger and Victoria.
By the early 1970s, population shifts had resulted in significant differences in the electorates of the wards. Although the wards continued to have four representatives on Belfast City Council, electorates varied from less than 5,000 in the smallest ward, Smithfield, to almost 40,000 in the largest ward, Victoria. The review of local government which took place in the early 1970s expanded Belfast to take in some of the newer housing estates on the fringes of the city and attempted to equalise electorates. Initially, Belfast was to have been divided into 52 wards. Following a public review, one ward, Tullycarnet, was excluded from Belfast and became instead the Castlereagh wards of Tullycarnet and Gilnahirk. The remaining 51 wards were intended to elect one member each using the first past the post electoral system. The reintroduction of the single transferable vote method of election meant that a different system was required. The 51 wards were therefore grouped into 8 electoral areas, distinguished by letters, with each electoral area returning either 6 or 7 councillors.
By the early 1980s, population shifts, demolition of some the older housing estates and residential flight caused by the Troubles had again led to substantial disparities in the electorates of the wards. Some wards in inner city Belfast such as Crumlin had lost over 70% of their population. The review of local government which took place from 1982 to 1984 created 51 new wards, many new or substantially different from their namesakes. The initial proposals, published in 1983, survived unchanged with a few exceptions. The proposed Peter's Hill ward was renamed Saint Anne's. The Donegall ward, one of the few unchanged wards, was renamed Blackstaff. In inner south Belfast, the Saint George's, university and Cromac wards were to have been replaced with an eastern ward, to be called Linenhall, and a western ward, to be called College. Following public inquiries, the wards were replaced with a southern ward, Botanic, and a northern ward, Shaftesbury, which merged the former Cromac and Saint George's wards. As in 1973, these wards were grouped into electoral areas electing between 5 and 7 councillors.
A further review took place in 1991–1992 and compared to the review of the 1980s, saw minor changes. In the Court electoral area, the existing Shankill ward was split between three other wards. One of these three wards which gained territory, Saint Anne's, having lost its eponymous area to the Duncairn ward, assumed the Shankill name. Initially the number of wards was to have been cut to 50, however after a public inquiry, a new 51st ward was created. Most of the existing Finaghy ward was renamed Musgrave, while a new Finaghy ward was created from the southern parts of the older Finaghy ward and the Upper Malone ward, which compensated by gaining territory from Malone and Stranmillis wards.
1993–2013[edit]
The table below shows the divisions from 1993 to 2013.
| Map | District Electoral Area | Councillors/ Wards |
Population (2008 Estimate) |
Population (2001 Census) |
Catholic | Protestant | Other | Area | Density | NI Assembly | UK Parliament |
|---|---|---|---|---|---|---|---|---|---|---|---|
 |
Balmoral | 6 | 29,681 | 31,942 | 40.8% | 53.0% | 6.2% | 13.71 km2 | 2,330/km2 | Belfast South | Belfast South |
 |
Castle | 6 | 28,290 | 29,016 | 44.3% | 51.6% | 4.1% | 19 km2 | 1,527/km2 | Belfast North | Belfast North |
 |
Court | 5 | 21,777 | 22,088 | 5.1% | 92.7% | 2.2% | 9.12 km2 | 2,422/km2 | Belfast North (2) Belfast West (3) |
Belfast North (2) Belfast West (3) |
 |
Laganbank | 5 | 32,316 | 33,358 | 54.8% | 37.7% | 7.5% | 8.37 km2 | 3,985/km2 | Belfast South | Belfast South |
 |
Lower Falls | 5 | 25,500 | 26,290 | 96.2% | 2.4% | 1.4% | 5.93 km2 | 4,433/km2 | Belfast West | Belfast West |
 |
Oldpark | 6 | 33,798 | 35,100 | 66.1% | 31.5% | 2.4% | 13.68 km2 | 2,566 /km2 | Belfast North | Belfast North |
 |
Pottinger | 6 | 31,272 | 30,687 | 15.7% | 78.2% | 6.1% | 6.17 km2 | 4,974 /km2 | Belfast East (4) Belfast South (2) |
Belfast East (4) Belfast South (2) |
 |
Upper Falls | 5 | 29,082 | 31,039 | 95.5% | 3.8% | 0.7% | 15.83 km2 | 1,961/km2 | Belfast West | Belfast West |
 |
Victoria | 7 | 36,607 | 37,691 | 6.7% | 87.0% | 6.3% | 20.2 km2 | 1,896 /km2 | Belfast East | Belfast East |
| Belfast City Council | 51 | 268,323 | 277,391 | 47.2% | 48.6% | 4.2% | 114.85 km2 | 2,415 /km2 | |||
- Note: data for DEAs in the above table is based on aggregating the referenced figures for the relevant wards in the table below.
| Ward | District Electoral Area | Population (2008 Estimate) |
Population (2001 Census) |
Catholic | Protestant | Other | Area | Density | NI Assembly | UK Parliament | Ref |
|---|---|---|---|---|---|---|---|---|---|---|---|
| Andersonstown | Upper Falls | 5,238 | 5,764 | 98.5% | 1.0% | 0.5% | 1.08 km2 | 5,337/km2 | Belfast West | Belfast West | [4] |
| Ardoyne | Oldpark | 6,106 | 6,602 | 96.4% | 3.2% | 0.4% | 0.58 km2 | 11,383 /km2 | Belfast North | Belfast North | [5] |
| Ballyhackamore | Victoria | 5,479 | 5,693 | 11.6% | 80.3% | 8.1% | 1.15 km2 | 4,950 /km2 | Belfast East | Belfast East | [6] |
| Ballymacarrett | Pottinger | 4,797 | 4,942 | 50.7% | 46.8% | 2.8% | 0.78 km2 | 6,336 /km2 | Belfast East | Belfast East | [7] |
| Ballynafeigh | Laganbank | 5,060 | 5,251 | 59.0% | 33.2% | 7.8% | 0.67 km2 | 7,837/km2 | Belfast South | Belfast South | [8] |
| Ballysillan | Oldpark | 5,854 | 6,020 | 4.4% | 90.7% | 4.9% | 1.11 km2 | 5,423 /km2 | Belfast North | Belfast North | [9] |
| Beechmount | Lower Falls | 5,530 | 5,504 | 92.2% | 3.7% | 4.1% | 0.84 km2 | 6,552/km2 | Belfast West | Belfast West | [10] |
| Bellevue | Castle | 4,750 | 4,942 | 60.7% | 35.2% | 4.1% | 2.96 km2 | 1,670/km2 | Belfast North | Belfast North | [11] |
| Belmont | Victoria | 5,980 | 6,025 | 3.9% | 89.6% | 6.5% | 1.79 km2 | 3,366 /km2 | Belfast East | Belfast East | [12] |
| Blackstaff | Balmoral | 3,673 | 3,964 | 4.2% | 91.4% | 4.4% | 1.92 km2 | 2,065/km2 | Belfast South | Belfast South | [13] |
| Bloomfield | Pottinger | 5,483 | 5,537 | 5.1% | 87.6% | 7.3% | 0.74 km2 | 7,482 /km2 | Belfast East | Belfast East | [14] |
| Botanic | Laganbank | 8,334 | 9,572 | 66.9% | 23.0% | 10.1% | 1.3 km2 | 7,363/km2 | Belfast South | Belfast South | [15] |
| Castleview | Castle | 4,769 | 4,878 | 31.2% | 64.3% | 4.5% | 1.41 km2 | 3,460/km2 | Belfast North | Belfast North | [16] |
| Cavehill | Castle | 4,965 | 5,282 | 51.3% | 45.1% | 3.6% | 3.41 km2 | 1,549/km2 | Belfast North | Belfast North | [17] |
| Cherryvalley | Victoria | 5,731 | 5,933 | 8.9% | 85.1% | 6.0% | 1.99 km2 | 2,981 /km2 | Belfast East | Belfast East | [18] |
| Chichester Park | Castle | 5,077 | 5,109 | 74.9% | 20.2% | 4.9% | 0.95 km2 | 5,378/km2 | Belfast North | Belfast North | [19] |
| Cliftonville | Oldpark | 5,093 | 5,421 | 68.3% | 29.2% | 2.5% | 1.18 km2 | 4,594 /km2 | Belfast North | Belfast North | [20] |
| Clonard | Lower Falls | 4,380 | 4,421 | 96.1% | 2.6% | 1.3% | 0.61 km2 | 7,248/km2 | Belfast West | Belfast West | [21] |
| Crumlin | Court | 4,362 | 4,376 | 3.6% | 93.9% | 2.5% | 0.83 km2 | 5,272/km2 | Belfast North | Belfast North | [22] |
| Duncairn | Castle | 4,055 | 4,007 | 5.5% | 90.2% | 4.3% | 9.24 km2 | 434/km2 | Belfast North | Belfast North | [23] |
| Falls | Lower Falls | 4,924 | 5,046 | 96.9% | 2.7% | 0.4% | 1.2 km2 | 4,205/km2 | Belfast West | Belfast West | [24] |
| Falls Park | Upper Falls | 5,234 | 5,888 | 97.7% | 1.8% | 0.5% | 2.35 km2 | 2,506/km2 | Belfast West | Belfast West | [25] |
| Finaghy | Balmoral | 4,468 | 4,994 | 44.6% | 49.8% | 5.6% | 2.59 km2 | 1,928/km2 | Belfast South | Belfast South | [26] |
| Fortwilliam | Castle | 4,674 | 4,798 | 32.9% | 64.1% | 3.0% | 1.03 km2 | 4,658/km2 | Belfast North | Belfast North | [27] |
| Glen Road | Upper Falls | 5,406 | 5,872 | 97.2% | 2.3% | 0.5% | 1.57 km2 | 3,740/km2 | Belfast West | Belfast West | [28] |
| Glencairn | Court | 3,693 | 4,026 | 12.3% | 85.2% | 2.5% | 4.1 km2 | 982/km2 | Belfast West | Belfast West | [29] |
| Glencolin | Upper Falls | 6,892 | 7,129 | 98.1% | 1.2% | 0.7% | 9.54 km2 | 747/km2 | Belfast West | Belfast West | [30] |
| Highfield | Court | 5,579 | 5,310 | 4.2% | 94.0% | 1.8% | 2.69 km2 | 1,974/km2 | Belfast West | Belfast West | [31] |
| Island | Victoria | 4,564 | 4,280 | 5.3% | 89.5% | 5.2% | 3.81 km2 | 1,123 /km2 | Belfast East | Belfast East | [32] |
| Knock | Victoria | 4,643 | 4,995 | 5.1% | 90.5% | 4.4% | 1.12 km2 | 4,460 /km2 | Belfast East | Belfast East | [33] |
| Ladybrook | Upper Falls | 6,312 | 6,384 | 86.5% | 12.3% | 1.2% | 1.29 km2 | 4,949/km2 | Belfast West | Belfast West | [34] |
| Legoniel | Oldpark | 5,808 | 5,528 | 37.7% | 59.2% | 3.1% | 8.82 km2 | 627 /km2 | Belfast North | Belfast North | [35] |
| Malone | Balmoral | 5,249 | 5,694 | 55.9% | 37.8% | 6.3% | 2.18 km2 | 2,612/km2 | Belfast South | Belfast South | [36] |
| Musgrave | Balmoral | 4,795 | 5,277 | 59.7% | 36.5% | 3.8% | 1.78 km2 | 2,965/km2 | Belfast South | Belfast South | [37] |
| New Lodge | Oldpark | 4,988 | 5,224 | 97.3% | 2.2% | 0.5% | 0.72 km2 | 7,256 /km2 | Belfast North | Belfast North | [38] |
| Orangefield | Pottinger | 5,565 | 5,496 | 3.3% | 91.0% | 5.7% | 1.46 km2 | 3,764 /km2 | Belfast East | Belfast East | [39] |
| Ravenhill | Pottinger | 5,610 | 5,500 | 25.5% | 67.3% | 7.2% | 1.88 km2 | 2,926 /km2 | Belfast South | Belfast South | [40] |
| Rosetta | Laganbank | 5,379 | 5,115 | 57.9% | 37.1% | 5.0% | 1.6 km2 | 3,197/km2 | Belfast South | Belfast South | [41] |
| Shaftesbury | Laganbank | 6,293 | 5,785 | 36.9% | 58.5% | 4.6% | 2.23 km2 | 2,594/km2 | Belfast South | Belfast South | [42] |
| Shankill | Court | 3,812 | 3,784 | 3.2% | 94.3% | 2.5% | 0.93 km2 | 4,067/km2 | Belfast West | Belfast West | [43] |
| Stormont | Victoria | 5,339 | 5,530 | 8.7% | 85.2% | 6.1% | 7.04 km2 | 786 /km2 | Belfast East | Belfast East | [44] |
| Stranmillis | Laganbank | 7,250 | 7,635 | 48.3% | 43.9% | 7.8% | 2.47 km2 | 3,091/km2 | Belfast South | Belfast South | [45] |
| Sydenham | Victoria | 4,871 | 5,235 | 3.8% | 90.3% | 5.9% | 6.24 km2 | 839 /km2 | Belfast East | Belfast East | [46] |
| The Mount | Pottinger | 4,893 | 4,259 | 4.0% | 89.7% | 6.3% | 0.75 km2 | 5,679 /km2 | Belfast East | Belfast East | [47] |
| Upper Malone | Balmoral | 4,567 | 4,926 | 24.7% | 69.1% | 6.2% | 4.32 km2 | 1,140/km2 | Belfast South | Belfast South | [48] |
| Upper Springfield | Lower Falls | 5,370 | 5,895 | 96.9% | 2.5% | 0.6% | 2.5 km2 | 2,358/km2 | Belfast West | Belfast West | [49] |
| Water Works | Oldpark | 5,949 | 6,305 | 90.7% | 6.7% | 2.6% | 1.27 km2 | 4,965 /km2 | Belfast North | Belfast North | [50] |
| Whiterock | Lower Falls | 5,296 | 5,424 | 99.0% | 0.7% | 0.3% | 0.78 km2 | 6,954/km2 | Belfast West | Belfast West | [51] |
| Windsor | Balmoral | 6,929 | 7,087 | 43.4% | 47.4% | 9.2% | 0.92 km2 | 7,703/km2 | Belfast South | Belfast South | [52] |
| Woodstock | Pottinger | 4,924 | 5,133 | 6.2% | 86.7% | 7.1% | 0.56 km2 | 9,166 /km2 | Belfast South | Belfast South | [53] |
| Woodvale | Court | 4,331 | 4,594 | 2.6% | 95.1% | 2.3% | 0.57 km2 | 8,060/km2 | Belfast North | Belfast North | [54] |
| Belfast City Council | 268,323 | 277,391 | 47.2% | 48.6% | 4.2% | 114.85 km2 | 2,415 /km2 | ||||
-
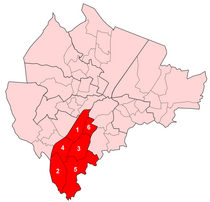 Balmoral
1. Blackstaff
2. Finaghy
3. Malone
4. Musgrave
5. Upper Malone
6. Windsor -
 Castle
1. Bellevue
2. Castleview
3. Cavehill
4. Chichester Park
5. Duncairn
6. Fortwilliam -
 Court
Court
1. Crumlin
2. Glencairn
3. Highfield
4. Shankill
5. Woodvale -
 Laganbank
1. Ballynafeigh
2. Botanic
3. Rosetta
4. Shaftesbury
5. Stranmillis -
 Lower Falls
1. Beechmount
2. Clonard
3. Falls
4. Upper Springfield
5. Whiterock -
 Oldpark
1. Ardoyne
2. Ballysillan
3. Cliftonville
4. Legoniel
5. New Lodge
6. Water Works -
 Pottinger
1. Ballymacarrett
2. Bloomfield
3. Orangefield
4. Ravenhill
5. The Mount
6. Woodstock -
 Upper Falls
1. Andersonstown
2. Falls Park
3. Glen Road
4. Glencolin
5. Ladybrook -
 Victoria
1. Ballyhackamore
2. Belmont
3. Cherryvalley
4. Island
5. Knock
6. Stormont
7. Sydenham


1973 to 1985[edit]
| Ward | Electoral area | Boundaries | Population (1971)[55] | Population (1981)[56] | Westminster constituency(s) |
|---|---|---|---|---|---|
| Rosetta | A | Upper Ormeau Road and Rosetta areas | 7,633 | 6,628 | |
| Ballynafeigh | A | Ballynafeigh | 6,674 | 5,231 | |
| Ormeau | A | Areas around Ravenhill Road from Park Road to Albert Bridge Road | 6,710 | 4,718 | |
| Willowfield | A | Areas bordering Woodstock and Cregagh Roads to city boundary | 7,417 | 6,292 | |
| Orangefield | A | Orangefield | 7,921 | 6,801 | |
| The Mount | A | Bordered by Ravenhill Rd, My Lady's Rd, Willowfield St, Clara St, Beersbridge Rd, Connswater and Albertbridge Rd | 8,765 | 4,640 | |
| Ballymacarrett | A | Areas between Newtownards Rd and Albertbridge Rd | 8,743 | 4,472 | |
| Island | B | Areas north of Newtownards Rd and between rivers Connswater and Lagan | 8,665 | 4,100 | |
| Sydenham | B | Bordered by Connswater, Newtownards Rd, Holywood Rd and Belfast Rd | 7,931 | 6,606 | |
| Belmont | B | Bordered by Holywood Rd, Belmont Rd and city boundary | 8,948 | 7,825 | |
| Bloomfield | B | Bordered by Bloomfield walkway, Connswater, Abetta Parade, Dunraven Gardens, North Rd and Grand Parade | 6,455 | 5,510 | |
| Ballyhackamore | B | Bordered by Bloomfield walkway, Belmont Road, Belmont Church Rd, Knock Parkand area north of Orangefield Rd and Sandhill Gardens | 7,493 | 6,434 | |
| Shandon | B | Knock, Shandon and Cherryvalley areas | 8,715 | 7,985 | |
| Stormont | B | Areas north of Upper Newtownards Rd, east of Belmont Church Rd and south and east of Belmont Road | 8,778 | 7,675 | |
| Finaghy | C | Finaghy | 7,376 | 6,599 | |
| Upper Malone | C | Upper Malone and Taughmonagh areas | 7,920 | 7,038 | |
| Malone | C | areas around Malone Road | 6,775 | 6,462 | |
| Windsor | C | Windsor | 9,925 | 6,600 | |
| Stranmillis | C | Stranmillis | 7939 | 6541 | |
| University | C | Areas around Queen's University and Lower Ormeau Road | 7,830 | 4,609 | |
| Saint James | D | Beechmount and Saint James areas | 9,202 | 8,043 | |
| Whiterock | D | 10,861 | 6,847 | ||
| Milltown | D | areas around Milltown Cemetery and Falls Park | 9,864 | 7,291 | |
| Andersonstown | D | Andersonstown and Glen Road areas | 8,433 | 6,406 | |
| Suffolk | D | Glencolin and Suffolk areas | 11,031 | 9,396 | |
| Ladybrook | D | 11,044 | 10,085 | ||
| Legoniel | E | 7,218 | 5,504 | ||
| Ballysillan | E | Ballysillan | 8,181 | 5,967 | |
| Ardoyne | E | Ardoyne and Glenbryn areas | 9,547 | 5,902 | |
| Ballygomartin | E | Ballygomartin and Glencairn areas | 7,734 | 8,467 | |
| Highfield | E | Highfield | 8,516 | 5,703 | |
| Woodvale | E | Woodvale | 7,628 | 5,889 | |
| Falls | F | Lower Falls Road around Divis tower | 5,655 | 2,645 | |
| Clonard | F | Clonard | 8,491 | 5,463 | |
| Grosvenor | F | Areas around Grosvenor Road | 7,385 | 2,239 | |
| Donegall | F | Areas currently between Westlink and Railway line, southern boundary Stockman's Lane | 7,789 | 6,227 | |
| Saint Georges | F | Sandy Row and The Village | 7,690 | 2,931 | |
| Cromac | F | Donegall Pass and The Markets | 6,991 | 2,446 | |
| New Lodge | G | Bordered by Antrim Road, Duncairn Gardens, North Queen Street and Clifton Street | 8,090 | 5,097 | |
| Central | G | Barrack St and John St, Brown Square, City Centre, Docks including all areas between Motorway and Belfast Lough, Henry St and Lancaster St areas, Smithfield, Unity Flats | 7,085 | 2,132 | |
| Shankill | G | Areas between Shankill and Crumlin Roads, east of Cambrai St as far as western half of Crimea St | 8,337 | 5,811 | |
| Crumlin | G | Bounded by Flax St, Ardoyne Ave, Oldpark Ave, Cliftonville Rd, Antrim Rd and Crumlin Rd | 12,414 | 3,250 | |
| Court | G | From Carlisle Circus, down the Westlink, up Divis Street, along Northumberland Street, the Shankill Road, Crimea Street and then down the Crumlin Road to Carlisle Circus | 7,345 | 3,325 | |
| North Howard | G | Starting from the Falls Rd, along North Howard St, Cupar Way and Lanark Way, down the Shankill Rd and along Northumberland St and the Falls Rd | 6,957 | 1,883 | |
| Bellevue | H | Bellevue | 7,530 | 6,256 | |
| Castleview | H | Innisfayle, Downview and Parkmount areas | 7,653 | 6,766 | |
| Grove | H | Areas from Skegoniell Avenue to Mountcollyer Street and Lower Cavehill Road to Kansas Avenue | 6,230 | 4,635 | |
| Duncairn | H | Tiger's Bay and Newington | 8,408 | 4,196 | |
| Fortwilliam | H | Fortwilliam | 6,690 | 5,879 | |
| Cavehill | H | Cavehill Road and areas to Kansas Avenue | 8,430 | 8,239 | |
| Cliftonville | H | Cliftonville, Torrens and Brookvale areas | 9,637 | 7,537 |
See also[edit]
- Belfast City Council
- Belfast City Council elections, May 2011
- Local government in Northern Ireland
- Members of Belfast City Council
- Subdivisions of Belfast
References[edit]
- ^ "Local Government (Boundaries) Act (Northern Ireland) 2008". National Archives. Retrieved 24 April 2019.
- ^ "Geography". Northern Ireland Statistics and Research Agency. Retrieved 12 June 2011.
- ^ Map Archived 5 May 2016 at the Wayback Machine from the District Electoral Areas Commissioner Maps page Archived 5 May 2016 at the Wayback Machine. See District Electoral Areas Commissioner page Archived 5 May 2016 at the Wayback Machine
- ^ "Ward Information for Andersonstown ward 95GG01". NISRA. Retrieved 13 June 2011.
- ^ "Ward Information for Ardoyne ward 95GG02". NISRA. Retrieved 13 June 2011.
- ^ "Ward Information for Ballyhackamore ward 95GG03". NISRA. Retrieved 13 June 2011.
- ^ "Ward Information for Ballymacarrett ward 95GG04". NISRA. Retrieved 13 June 2011.
- ^ "Ward Information for Ballynafeigh ward 95GG05". NISRA. Retrieved 13 June 2011.
- ^ "Ward Information for Ballysillan ward 95GG06". NISRA. Retrieved 13 June 2011.
- ^ "Ward Information for Beechmount ward 95GG07". NISRA. Retrieved 13 June 2011.
- ^ "Ward Information for Bellevue ward 95GG08". NISRA. Retrieved 13 June 2011.
- ^ "Ward Information for Belmont ward 95GG09". NISRA. Retrieved 13 June 2011.
- ^ "Ward Information for Blackstaff ward 95GG10". NISRA. Retrieved 13 June 2011.
- ^ "Ward Information for Bloomfield (Belfast) ward 95GG11". NISRA. Retrieved 13 June 2011.
- ^ "Ward Information for Botanic ward 95GG12". NISRA. Retrieved 13 June 2011.
- ^ "Ward Information for Castleview ward 95GG13". NISRA. Retrieved 13 June 2011.
- ^ "Ward Information for Cavehill ward 95GG14". NISRA. Retrieved 13 June 2011.
- ^ "Ward Information for Cherryvalley ward 95GG15". NISRA. Retrieved 13 June 2011.
- ^ "Ward Information for Chichester Park ward 95GG16". NISRA. Retrieved 13 June 2011.
- ^ "Ward Information for Cliftonville ward 95GG17". NISRA. Retrieved 13 June 2011.
- ^ "Ward Information for Clonard ward 95GG18". NISRA. Retrieved 13 June 2011.
- ^ "Ward Information for Crumlin (Belfast) ward 95GG19". NISRA. Retrieved 13 June 2011.
- ^ "Ward Information for Duncairn ward 95GG20". NISRA. Retrieved 13 June 2011.
- ^ "Ward Information for Falls ward 95GG21". NISRA. Retrieved 13 June 2011.
- ^ "Ward Information for Falls Park ward 95GG22". NISRA. Retrieved 13 June 2011.
- ^ "Ward Information for Finaghy ward 95GG23". NISRA. Retrieved 13 June 2011.
- ^ "Ward Information for Fortwilliam ward 95GG24". NISRA. Retrieved 13 June 2011.
- ^ "Ward Information for Glen Road ward 95GG25". NISRA. Retrieved 13 June 2011.
- ^ "Ward Information for Glencairn ward 95GG26". NISRA. Retrieved 13 June 2011.
- ^ "Ward Information for Glencolin ward 95GG27". NISRA. Retrieved 13 June 2011.
- ^ "Ward Information for Highfield ward 95GG28". NISRA. Retrieved 13 June 2011.
- ^ "Ward Information for Island ward 95GG29". NISRA. Retrieved 13 June 2011.
- ^ "Ward Information for Knock ward 95GG30". NISRA. Retrieved 13 June 2011.
- ^ "Ward Information for Ladybrook ward 95GG31". NISRA. Retrieved 13 June 2011.
- ^ "Ward Information for Legoniel ward 95GG32". NISRA. Retrieved 13 June 2011.
- ^ "Ward Information for Malone ward 95GG33". NISRA. Retrieved 13 June 2011.
- ^ "Ward Information for Musgrave ward 95GG34". NISRA. Retrieved 13 June 2011.
- ^ "Ward Information for New Lodge ward 95GG35". NISRA. Retrieved 13 June 2011.
- ^ "Ward Information for Orangefield ward 95GG36". NISRA. Retrieved 13 June 2011.
- ^ "Ward Information for Ravenhill ward 95GG37". NISRA. Retrieved 13 June 2011.
- ^ "Ward Information for Rosetta ward 95GG38". NISRA. Retrieved 13 June 2011.
- ^ "Ward Information for Shaftesbury ward 95GG39". NISRA. Retrieved 13 June 2011.
- ^ "Ward Information for Shankill ward 95GG40". NISRA. Retrieved 13 June 2011.
- ^ "Ward Information for Stormont ward 95GG41". NISRA. Retrieved 13 June 2011.
- ^ "Ward Information for Stranmillis ward 95GG42". NISRA. Retrieved 13 June 2011.
- ^ "Ward Information for Sydenham ward 95GG43". NISRA. Retrieved 13 June 2011.
- ^ "Ward Information for The Mount ward 95GG44". NISRA. Retrieved 13 June 2011.
- ^ "Ward Information for Upper Malone ward 95GG45". NISRA. Retrieved 13 June 2011.
- ^ "Ward Information for Upper Springfield ward 95GG46". NISRA. Retrieved 13 June 2011.
- ^ "Ward Information for Water Works ward 95GG47". NISRA. Retrieved 13 June 2011.
- ^ "Ward Information for Whiterock ward 95GG48". NISRA. Retrieved 13 June 2011.
- ^ "Ward Information for Windsor ward 95GG49". NISRA. Retrieved 13 June 2011.
- ^ "Ward Information for Woodstock ward 95GG50". NISRA. Retrieved 13 June 2011.
- ^ "Ward Information for Woodvale ward 95GG51". NISRA. Retrieved 13 June 2011.
- ^ Northern Ireland Census, 1971 summary tables, Table 4
- ^ Northern Ireland Census, 1981 summary tables, Table 4
