
User:Wslshin/sandbox

| |||||||||||||||||||||||||||||
538 members of the Electoral College 270 electoral votes needed to win | |||||||||||||||||||||||||||||
|---|---|---|---|---|---|---|---|---|---|---|---|---|---|---|---|---|---|---|---|---|---|---|---|---|---|---|---|---|---|
| Opinion polls | |||||||||||||||||||||||||||||
| Turnout | 66.7% | ||||||||||||||||||||||||||||
| |||||||||||||||||||||||||||||
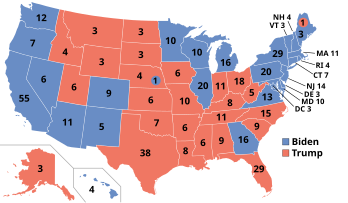 Presidential election results map. Blue denotes states won by Biden/Harris, and red denotes those won by Trump/Pence. Numbers indicate electoral votes cast by each state and the District of Columbia. | |||||||||||||||||||||||||||||
| |||||||||||||||||||||||||||||

.jpg)
Summary[edit]
| |||||||||||||||||||||||||||||||||||||
All 383 seats in the United States House of Representatives[c] 192 seats needed for a majority | |||||||||||||||||||||||||||||||||||||
|---|---|---|---|---|---|---|---|---|---|---|---|---|---|---|---|---|---|---|---|---|---|---|---|---|---|---|---|---|---|---|---|---|---|---|---|---|---|
| |||||||||||||||||||||||||||||||||||||
 Results of the elections: Democratic gain Republican gain Democratic hold Republican hold Result undetermined | |||||||||||||||||||||||||||||||||||||
| |||||||||||||||||||||||||||||||||||||
.jpg)

| 300 | 10 | 285 | 41 | 14 |
| Conservative | DU | Labour | SNP | O |

After all 650 constituencies had been declared, the results were:[6][7]
| Party | Leader | MPs | |||
|---|---|---|---|---|---|
| Of total | |||||
| Conservative Party | Theresa May | 300 | 46.2% | 300 / 650
| |
| Labour Party | Jeremy Corbyn | 285 | 43.8% | 285 / 650
| |
| Scottish National Party | Nicola Sturgeon | 41 | 6.3% | 41 / 650
| |
| Democratic Unionist Party | Arlene Foster | 10 | 1.5% | 10 / 650
| |
| Sinn Féin | Gerry Adams | 7 | 1.1% | 7 / 650
| |
| Plaid Cymru | Leanne Wood | 4 | 0.6% | 4 / 650
| |
| Green Party of England and Wales | Jonathan Bartley Caroline Lucas |
1 | 0.2% | 1 / 650
| |
| Speaker | John Bercow | 1 | 0.2% | 1 / 650
| |
| Independent | Sylvia Hermon | 1 | 0.2% | 1 / 650
| |
Full results[edit]

| ||||||||||||||
| Political party | Leader | MPs | Votes | |||||||||||
|---|---|---|---|---|---|---|---|---|---|---|---|---|---|---|
| Candidates[8] | Total | Gained | Lost | Net | Of total (%) | Total | Of total (%) | Change (%) | ||||||
| Conservative[9] | Theresa May | 638 | 317 | 20 | 33 | −13 | 48.8 | 13,636,684 | 42.3 | +5.5 | ||||
| Labour | Jeremy Corbyn | 631 | 262 | 36 | 6 | +30 | 40.3 | 12,877,918 | 40.0 | +9.6 | ||||
| Liberal Democrats | Tim Farron | 629 | 12 | 8 | 4 | +4 | 1.8 | 2,371,861 | 7.4 | −0.5 | ||||
| SNP | Nicola Sturgeon | 59 | 35 | 0 | 21 | −21 | 5.4 | 977,568 | 3.0 | −1.7 | ||||
| UKIP | Paul Nuttall | 378 | 0 | 0 | 1 | −1 | 0 | 594,068 | 1.8 | −10.8 | ||||
| Green Party of England and Wales | Caroline Lucas and Jonathan Bartley | 457 | 1 | 0 | 0 | 0 | 0.2 | 525,665 | 1.6 | −2.0 | ||||
| DUP | Arlene Foster | 17 | 10 | 2 | 0 | +2 | 1.5 | 292,316 | 0.9 | +0.3 | ||||
| Sinn Féin | Gerry Adams | 18 | 7 | 3 | 0 | +3 | 1.1 | 238,915 | 0.7 | +0.1 | ||||
| Plaid Cymru | Leanne Wood | 40 | 4 | 1 | 0 | +1 | 0.6 | 164,466 | 0.5 | −0.1 | ||||
| Independent | 187 | 1 | 0 | 0 | 0 | 0.2 | 151,471 | 0.5 | +0.2 | |||||
| SDLP | Colum Eastwood | 18 | 0 | 0 | 3 | −3 | 0 | 95,419 | 0.3 | 0.0 | ||||
| Ulster Unionist | Robin Swann | 14 | 0 | 0 | 2 | −2 | 0 | 83,280 | 0.3 | −0.1 | ||||
| Alliance | Naomi Long | 18 | 0 | 0 | 0 | 0 | 0 | 64,553 | 0.2 | 0.0 | ||||
| Speaker | John Bercow | 1 | 1 | 0 | 0 | 0 | 0.2 | 34,299 | 0.1 | 0.0 | ||||
| Yorkshire | Stewart Arnold | 21 | 0 | 0 | 0 | 0 | 0 | 20,958 | 0.1 | +0.1 | ||||
| NHA | Alex Ashman | 5 | 0 | 0 | 0 | 0 | 0 | 16,119 | 0.1 | −0.1 | ||||
| CPA | Sidney Cordle | 31 | 0 | 0 | 0 | 0 | 0 | 5,869 | 0.0 | 0.0 | ||||
| People Before Profit | Eamonn McCann | 2 | 0 | 0 | 0 | 0 | 0 | 5,509 | 0.0 | 0.0 | ||||
| Ashfield Independents | 1 | 0 | 0 | 0 | 0 | 0 | 4,612 | 0.0 | 0.0 | |||||
| BNP | Adam Walker | 10 | 0 | 0 | 0 | 0 | 0 | 4,580 | 0.0 | 0.0 | ||||
| Monster Raving Loony | Alan Hope | 12 | 0 | 0 | 0 | 0 | 0 | 3,890 | 0.0 | 0.0 | ||||
| Liberal | Steve Radford | 4 | 0 | 0 | 0 | 0 | 0 | 3,672 | 0.0 | 0.0 | ||||
| Women's Equality | Sophie Walker | 7 | 0 | 0 | 0 | 0 | 0 | 3,580 | 0.0 | 0.0 | ||||
| TUV | Jim Allister | 1 | 0 | 0 | 0 | 0 | 0 | 3,282 | 0.0 | −0.1 | ||||
| North East Party | Mary Cartwright | 1 | 0 | 0 | 0 | 0 | 0 | 2,355 | 0.0 | 0.0 | ||||
| Pirate | David A Elston | 10 | 0 | 0 | 0 | 0 | 0 | 2,321 | 0.0 | 0.0 | ||||
| English Democrat | Robin Tilbrook | 7 | 0 | 0 | 0 | 0 | 0 | 1,913 | 0.0 | 0.0 | ||||
| Christian | Jeff Green | 2 | 0 | 0 | 0 | 0 | 0 | 1,720 | 0.0 | 0.0 | ||||
| Independent Save Withybush Save Lives | 1 | 0 | 0 | 0 | 0 | 0 | 1,209 | 0.0 | 0.0 | |||||
| Socialist Labour | Arthur Scargill | 3 | 0 | 0 | 0 | 0 | 0 | 1,154 | 0.0 | 0.0 | ||||
| Animal Welfare | Vanessa Hudson | 4 | 0 | 0 | 0 | 0 | 0 | 955 | 0.0 | 0.0 | ||||
| Justice & Anti-Corruption | 2 | 0 | 0 | 0 | 0 | 0 | 842 | 0.0 | 0.0 | |||||
| Southampton Independents | 1 | 0 | 0 | 0 | 0 | 0 | 816 | 0.0 | 0.0 | |||||
| Workers Revolutionary | Sheila Torrance | 5 | 0 | 0 | 0 | 0 | 0 | 771 | 0.0 | 0.0 | ||||
| Workers' Party | 2 | 0 | 0 | 0 | 0 | 0 | 708 | 0.0 | 0.0 | |||||
| Something New | 2 | 0 | 0 | 0 | 0 | 0 | 552 | 0.0 | 0.0 | |||||
| Demos Direct Initiative Party | 1 | 0 | 0 | 0 | 0 | 0 | 551 | 0.0 | 0.0 | |||||
| Libertarian | Adam Brown | 4 | 0 | 0 | 0 | 0 | 0 | 524 | 0.0 | 0.0 | ||||
| SDP | Peter Johnson | 6 | 0 | 0 | 0 | 0 | 0 | 469 | 0.0 | 0.0 | ||||
| Peace | John Morris | 2 | 0 | 0 | 0 | 0 | 0 | 468 | 0.0 | 0.0 | ||||
| Friends Party | 3 | 0 | 0 | 0 | 0 | 0 | 435 | 0.0 | 0.0 | |||||
| Better for Bradford | 1 | 0 | 0 | 0 | 0 | 0 | 420 | 0.0 | 0.0 | |||||
| All other parties | 38 | 0 | 0 | 0 | 0 | 0 | 5,447 | 0.0 | 0.0 | |||||
| Total | 3,304 | 650 | 32,204,184 | |||||||||||
Seats, of total, by party
Conservative (48.8%)
Labour (40.3%)
SNP (5.4%)
Liberal Democrats (1.8%)
DUP (1.5%)
Sinn Féin (1.1%)
Plaid Cymru (0.6%)
Green (0.2%)
Speaker (0.2%)
Independent (0.2%)
Votes, of total, by party
Conservative (42.3%)
Labour (40.0%)
Liberal Democrats (7.4%)
SNP (3.0%)
UKIP (1.8%)
Green (1.6%)
DUP (0.9%)
Sinn Féin (0.7%)
Plaid Cymru (0.5%)
Other (1.8%)
All parties with over 400 votes shown.

References[edit]
- ^ Knight, Stef W.; Ahmed, Naema (August 13, 2020). "When and how to vote in all 50 states". Axios.
- ^ McDonald, Michael (November 6, 2020). "2020 General Election Early Vote Statistics". U.S. Elections Project.
- ^ 2020 November General Election Turnout Rates, United States Election Project. This turnout figure is the estimated number of ballots counted (including ballots without a valid vote for president) divided by the estimated number of eligible voters (U.S. residents, excluding those ineligible to vote due to lack of U.S. citizenship or to a criminal conviction, and U.S. citizens residing in other countries, at or over age 18). This figure is preliminary and unofficial, and not comparable to figures for previous years calculated by the Federal Election Commission, which uses only valid votes for president divided by the U.S. population at or over age 18 (including those ineligible to vote, and not including U.S. citizens residing in other countries).
- ^ a b Cite error: The named reference
FECwas invoked but never defined (see the help page). - ^ Choi, Matthew (October 31, 2019). "Trump, a symbol of New York, is officially a Floridian now". Politico. Retrieved October 31, 2019.
- ^ "General Election 2017: full results and analysis". UK Parliament. Retrieved June 23, 2017.
- ^ "Results". BBC News. Retrieved December 14, 2017.
- ^ "Number of known 2017 General Election candidates per party". democracyclub.org.uk. Retrieved May 27, 2017.
- ^ BBC News includes the Speaker of the House of Commons, John Bercow, in the MP tally and the vote tally for the Conservatives. In this table, however, the speaker (who usually does not vote in the Commons) is listed separately, and has been removed from the Conservative tally.
Cite error: There are <ref group=lower-alpha> tags or {{efn}} templates on this page, but the references will not show without a {{reflist|group=lower-alpha}} template or {{notelist}} template (see the help page).