From Wikipedia, the free encyclopedia
Part of the 1991 Irish local elections
1991 Kilkenny County Council election|
|
|
|
|
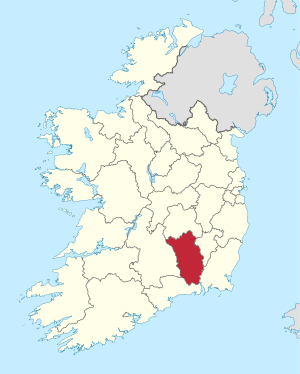 Map showing the area of Kilkenny County Council |
|
An election to Kilkenny County Council took place on 27 June 1991 as part of that year's Irish local elections. 26 councillors were elected from five local electoral areas (LEAs) for a five-year term of office on the electoral system of proportional representation by means of the single transferable vote (PR-STV). This term was extended twice, first to 1998, then to 1999.[1][2]
Results by party[edit]
Results by local electoral area[edit]
Ballyragget[edit]
Ballyragget - 5 seats
| Party |
Candidate |
FPv% |
Count
|
| 1 |
2 |
3 |
4 |
5 |
6 |
7 |
8 |
9
|
|
|
Fine Gael
|
Mary Hilda Cavanagh*
|
16.5%
|
1,142
|
1,155
|
|
|
|
|
|
|
|
|
|
Labour
|
Dick Brennan*
|
13.5%
|
931
|
981
|
988
|
1,011
|
1,049
|
1,191
|
|
|
|
|
|
Fianna Fáil
|
John Murphy*
|
12.6%
|
870
|
874
|
933
|
959
|
1,043
|
1,271
|
|
|
|
|
|
Fine Gael
|
John Brennan
|
11.5%
|
797
|
802
|
804
|
820
|
1,094
|
1,212
|
|
|
|
|
|
Fianna Fáil
|
Martin Fitzpatrick
|
9.9%
|
682
|
685
|
758
|
882
|
902
|
967
|
1,033
|
1,059
|
1,089
|
|
|
Fianna Fáil
|
Patricia Owens
|
9.4%
|
650
|
653
|
661
|
677
|
698
|
|
|
|
|
|
|
Fianna Fáil
|
Shem O'Donnell
|
8.8%
|
609
|
631
|
737
|
768
|
848
|
959
|
1,010
|
1,021
|
1,028
|
|
|
Fine Gael
|
Kathleen Conroy
|
7.4%
|
509
|
513
|
519
|
555
|
|
|
|
|
|
|
|
Independent
|
Brid Phelan
|
4.5%
|
313
|
316
|
350
|
|
|
|
|
|
|
|
|
Fianna Fáil
|
Michael Wilson
|
4.4%
|
304
|
306
|
|
|
|
|
|
|
|
|
|
Labour
|
John Bergin
|
1.6%
|
111
|
|
|
|
|
|
|
|
|
| Electorate: 9,780 Valid: 6,918 (70.74%) Spoilt: 78 Quota: 1,154 Turnout: 6,996 (71.53%)
|
Kilkenny[edit]
Piltown[edit]
Piltown - 7 seats
| Party |
Candidate |
FPv% |
Count
|
| 1 |
2 |
3 |
4 |
5 |
6 |
7 |
8
|
|
|
Fianna Fáil
|
Liam Aylward TD*
|
23.6%
|
1,906
|
|
|
|
|
|
|
|
|
|
Fine Gael
|
Dick Dowling*
|
15.2%
|
1,229
|
|
|
|
|
|
|
|
|
|
Fine Gael
|
Andy Cotterell*
|
9.5%
|
763
|
812
|
896
|
914
|
931
|
1,069
|
|
|
|
|
Labour
|
Joe Walsh
|
9.3%
|
750
|
795
|
814
|
1,045
|
|
|
|
|
|
|
Fine Gael
|
John Maher*
|
8.6%
|
697
|
753
|
773
|
784
|
795
|
1,081
|
|
|
|
|
Fianna Fáil
|
Marguerite Drea
|
6.6%
|
534
|
676
|
682
|
690
|
822
|
837
|
843
|
849
|
|
|
Fianna Fáil
|
Dick Dunphy*
|
6.4%
|
517
|
739
|
748
|
754
|
855
|
922
|
962
|
981
|
|
|
Fine Gael
|
Catherine Kearns
|
6%
|
482
|
508
|
563
|
579
|
596
|
|
|
|
|
|
Fianna Fáil
|
Ann Blackmore
|
5.7%
|
456
|
678
|
682
|
702
|
823
|
858
|
884
|
890
|
|
|
Workers' Party
|
Martin Kennedy*
|
4.9%
|
396
|
421
|
434
|
|
|
|
|
|
|
|
Fianna Fáil
|
Albert Byrne
|
4.2%
|
335
|
445
|
455
|
491
|
|
|
|
|
| Electorate: 12,979 Valid: 8,065 (62.14%) Spoilt: 106 Quota: 1,009 Turnout: 8,171 (62.96%)
|
Thomastown[edit]
Thomastown - 6 seats
| Party |
Candidate |
FPv% |
Count
|
| 1 |
2 |
3 |
4 |
5 |
6 |
7
|
|
|
Fianna Fáil
|
James Brett*
|
15.7%
|
1,179
|
|
|
|
|
|
|
|
|
Labour
|
Michael O'Brien*
|
14%
|
1,055
|
1,061
|
1,075
|
|
|
|
|
|
|
Fianna Fáil
|
Kevin Fennelly
|
12.3%
|
922
|
948
|
965
|
1,028
|
|
|
|
|
|
Fine Gael
|
Billy Ireland*
|
11.1%
|
835
|
841
|
858
|
904
|
936
|
946
|
1,015
|
|
|
Fine Gael
|
Tom Maher
|
9.2%
|
692
|
701
|
717
|
780
|
940
|
960
|
991
|
|
|
Labour
|
John Bolger
|
8.6%
|
646
|
648
|
657
|
689
|
703
|
708
|
|
|
|
Fine Gael
|
Philip Brennan*
|
8%
|
600
|
605
|
610
|
699
|
716
|
729
|
815
|
|
|
Fianna Fáil
|
Michael Fenlon*
|
7.6%
|
573
|
586
|
594
|
606
|
675
|
806
|
1,039
|
|
|
Fianna Fáil
|
Breda Somers*
|
6.6%
|
493
|
518
|
528
|
598
|
|
|
|
|
|
Progressive Democrats
|
Patrick Crowley
|
4.7%
|
350
|
360
|
434
|
|
|
|
|
|
|
Progressive Democrats
|
Donal McDonald
|
2.3%
|
175
|
177
|
|
|
|
|
|
| Electorate: 11,771 Valid: 7,520 (63.89%) Spoilt: 96 Quota: 1,075 Turnout: 7,616 (64.7%)
|
Tullaroan[edit]
References[edit]
External links[edit]


