From Wikipedia, the free encyclopedia
Part of the 1991 Irish local elections
1991 North Tipperary County Council election|
|
|
|
|
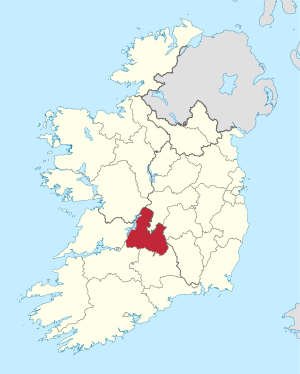 Map showing the area of North Tipperary County Council |
|
|
Council control after election
Fianna Fail
| |
An election to North Tipperary County Council took place on 27 June 1991 as part of that year's Irish local elections. 21 councillors were elected from four local electoral areas (LEAs) for a five-year term of office on the electoral system of proportional representation by means of the single transferable vote (PR-STV). This term was extended twice, first to 1998, then to 1999.[1][2]
Results by party[edit]
Results by local electoral area[edit]
Borrisokane[edit]
Borrisokane - 4 seats
| Party |
Candidate |
FPv% |
Count
|
| 1 |
2 |
3 |
4 |
5
|
|
|
Fianna Fáil
|
Jim Casey*
|
21.5%
|
1,212
|
|
|
|
|
|
|
Fianna Fáil
|
Senator Tony McKenna*
|
17.2%
|
970
|
1,007
|
1,028
|
1,139
|
|
|
|
Fianna Fáil
|
Michael Hough*
|
13.2%
|
745
|
763
|
791
|
884
|
1,229
|
|
|
Fine Gael
|
Gerard Darcy
|
12.1%
|
681
|
718
|
727
|
884
|
999
|
|
|
Fianna Fáil
|
John Carroll
|
11.2%
|
630
|
642
|
656
|
738
|
|
|
|
Fine Gael
|
Liam Whyte*
|
10.9%
|
613
|
672
|
678
|
805
|
858
|
|
|
Labour
|
Larry Dunne
|
10.1%
|
567
|
620
|
625
|
|
|
|
|
Progressive Democrats
|
Tony Esmonde
|
4%
|
224
|
|
|
|
|
| Electorate: 7,902 Valid: 5,642 (71.4%) Spoilt: 54 Quota: 1,129 Turnout: 5,696 (72.08%)
|
Nenagh-Newport[edit]
Nenagh-Newport - 7 seats
| Party |
Candidate |
FPv% |
Count
|
| 1 |
2 |
3 |
4 |
5 |
6 |
7 |
8 |
9 |
10
|
|
|
Fine Gael
|
Willie Kennedy*
|
11.9%
|
1,182
|
1,182
|
1,184
|
1,196
|
1,234
|
1,249
|
|
|
|
|
|
|
Labour
|
Senator John Ryan*
|
11.2%
|
1,107
|
1,114
|
1,156
|
1,179
|
1,325
|
|
|
|
|
|
|
|
Fianna Fáil
|
Tom Harrington*
|
10.1%
|
998
|
999
|
1,001
|
1,018
|
1,036
|
1,040
|
1,498
|
|
|
|
|
|
Fine Gael
|
Tom Ryan
|
9.6%
|
950
|
951
|
952
|
972
|
981
|
995
|
1,042
|
1,074
|
1,148
|
1,164
|
|
|
Fianna Fáil
|
John Sheehy*
|
8.2%
|
808
|
808
|
820
|
833
|
840
|
840
|
863
|
923
|
1,019
|
1,235
|
|
|
Fianna Fáil
|
Mattie (Coole) Ryan
|
8%
|
795
|
796
|
797
|
802
|
823
|
826
|
851
|
870
|
974
|
1,154
|
|
|
Independent
|
Joseph O'Connor*
|
7.8%
|
767
|
774
|
779
|
790
|
797
|
811
|
927
|
955
|
1,043
|
1,141
|
|
|
Fine Gael
|
Tom Berkery*
|
6.8%
|
673
|
677
|
680
|
724
|
746
|
768
|
782
|
928
|
944
|
1,014
|
|
|
Fianna Fáil
|
Ger Ryan
|
5.8%
|
570
|
570
|
571
|
576
|
587
|
596
|
641
|
650
|
|
|
|
|
Fianna Fáil
|
Sean Boland
|
5.7%
|
564
|
566
|
588
|
594
|
602
|
604
|
615
|
764
|
796
|
|
|
|
Fine Gael
|
Martin O'Sullivan
|
4.7%
|
467
|
483
|
521
|
527
|
528
|
530
|
539
|
|
|
|
|
|
Sinn Féin
|
Jimmy Nolan
|
3.7%
|
364
|
364
|
364
|
376
|
384
|
386
|
|
|
|
|
|
|
Labour
|
Matt Ryan
|
2.9%
|
283
|
285
|
299
|
301
|
|
|
|
|
|
|
|
|
Progressive Democrats
|
Michael Flannery
|
1.6%
|
154
|
179
|
180
|
|
|
|
|
|
|
|
|
|
Labour
|
Patrick Coleman
|
1.5%
|
148
|
149
|
|
|
|
|
|
|
|
|
|
|
Progressive Democrats
|
John English
|
0.7%
|
68
|
|
|
|
|
|
|
|
|
|
| Electorate: 14,173 Valid: 9,898 (69.84%) Spoilt: 104 Quota: 1,238 Turnout: 10,002 (70.6%)
|
Roscrea-Templemore[edit]
Roscrea-Templemore - 5 seats
| Party |
Candidate |
FPv% |
Count
|
| 1 |
2 |
3 |
4 |
5
|
|
|
Fine Gael
|
Denis Ryan*
|
21.6%
|
1,446
|
|
|
|
|
|
|
Fianna Fáil
|
John Egan*
|
16.25%
|
1,086
|
1,095
|
1,130
|
|
|
|
|
Fianna Fáil
|
Dan Smith*
|
14.8%
|
988
|
1,033
|
1,060
|
1,139
|
|
|
|
Fianna Fáil
|
Seán Mulrooney
|
13.7%
|
916
|
989
|
1,012
|
1,043
|
1,046
|
|
|
Fine Gael
|
Noel Coonan
|
13.2%
|
879
|
979
|
1,012
|
1,114
|
1,116
|
|
|
Fine Gael
|
John Butler
|
12.3%
|
821
|
891
|
918
|
1,025
|
1,028
|
|
|
Labour
|
Liam Leahy
|
5.3%
|
356
|
376
|
412
|
|
|
|
|
Progressive Democrats
|
Michael Treacy
|
2.9%
|
192
|
206
|
|
|
|
| Electorate: 9,940 Valid: 6,684 (67.2%) Spoilt: 66 Quota: 1,140 Turnout: 6,750 (67.9%)
|
Thurles[edit]
Thurles - 5 seats
| Party |
Candidate |
FPv% |
Count
|
| 1 |
2 |
3 |
4 |
5 |
6
|
|
|
Fine Gael
|
Michael Lowry TD*
|
30.8%
|
1,958
|
|
|
|
|
|
|
|
Fianna Fáil
|
Mary Hanafin*
|
18.9%
|
1,204
|
|
|
|
|
|
|
|
Fianna Fáil
|
Harry Ryan*
|
14.6%
|
926
|
1,009
|
1,046
|
1,061
|
|
|
|
|
Fine Gael
|
Mae Quinn
|
9.4%
|
596
|
1,149
|
|
|
|
|
|
|
Fianna Fáil
|
Larry Looby*
|
9.18%
|
584
|
648
|
709
|
717
|
753
|
873
|
|
|
Progressive Democrats
|
Frank Dwan*
|
6.9%
|
442
|
505
|
529
|
557
|
614
|
|
|
|
Labour
|
Martin Kennedy
|
6.7%
|
427
|
512
|
526
|
551
|
668
|
918
|
|
|
Independent
|
Denis Ryan
|
3.6%
|
227
|
276
|
283
|
283
|
|
|
| Electorate: 10,367 Valid: 6,364 (61.4%) Spoilt: 62 Quota: 1,061 Turnout: 6,426 (62%)
|
References[edit]
External links[edit]


